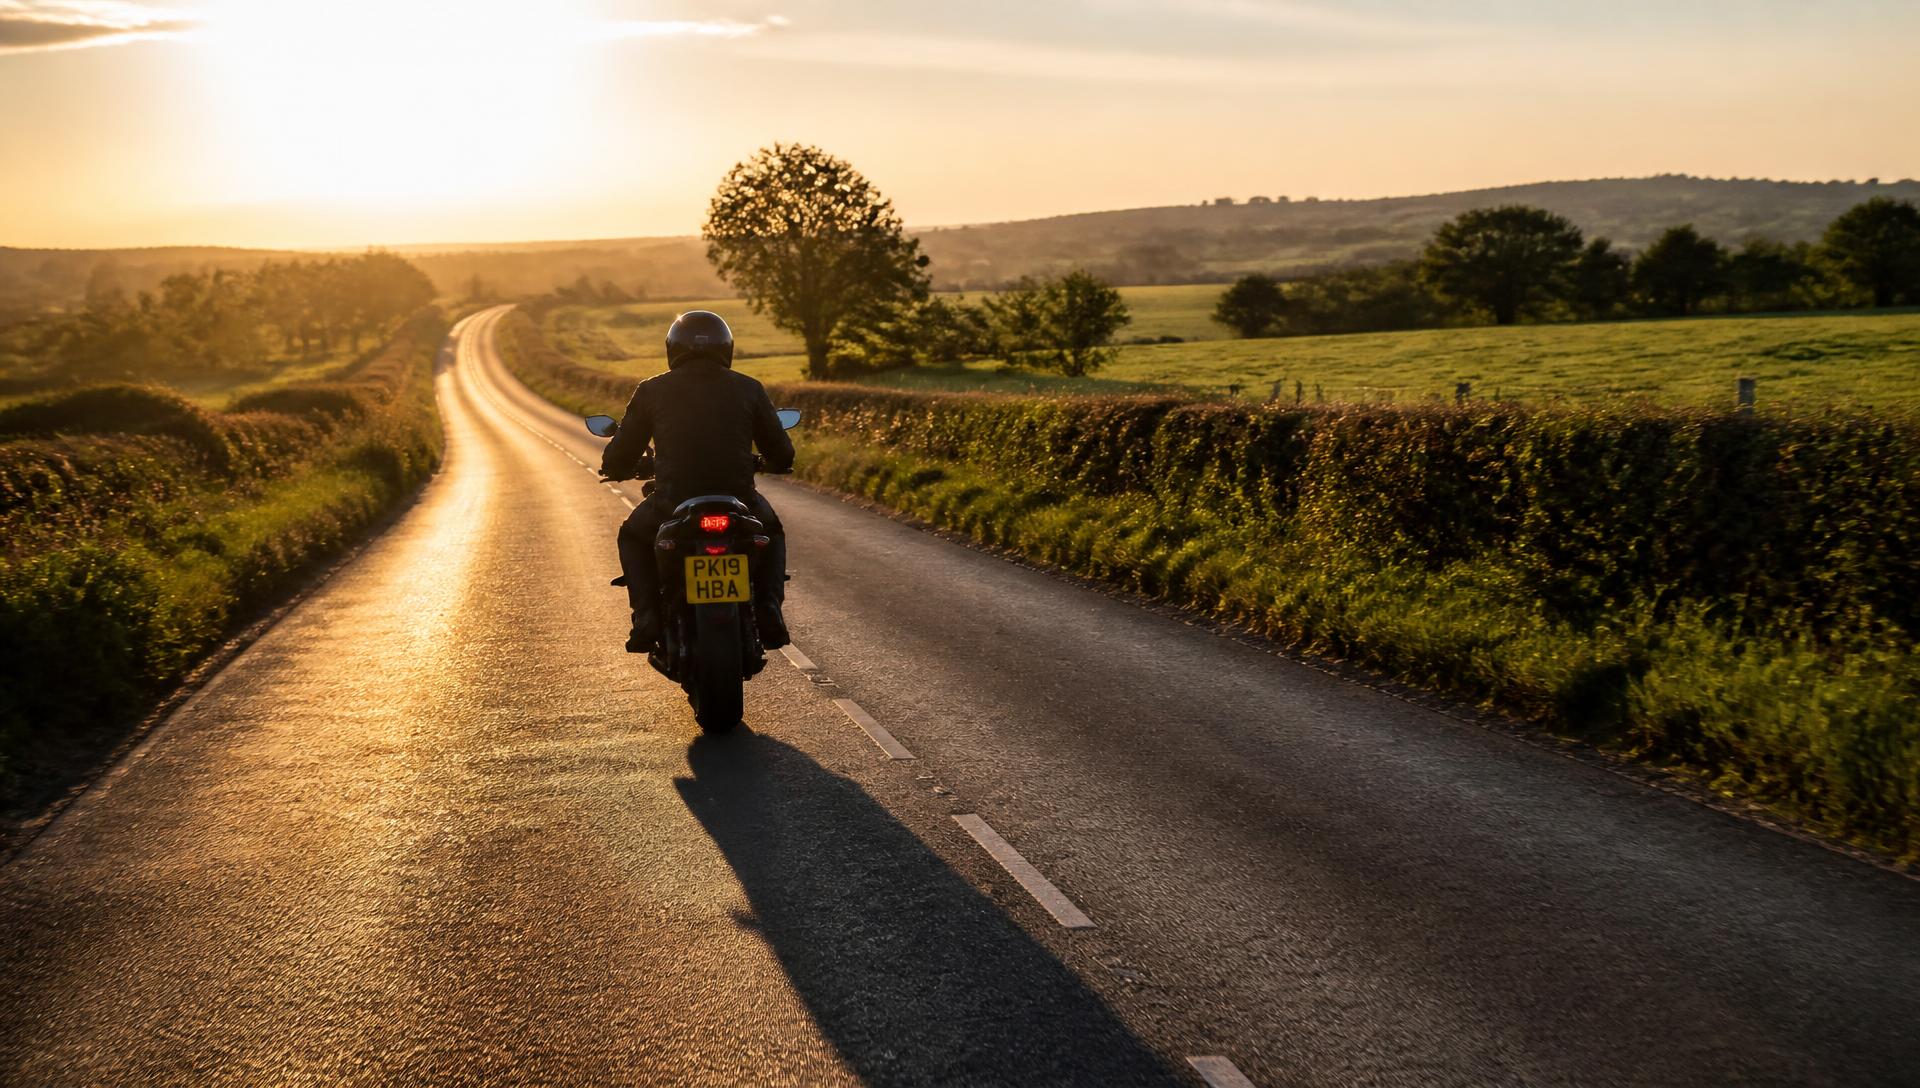
A motorcyclist in a crash helmet riding away from the camera along an empty rural British A-road into a low late-afternoon sun, long shadow stretching across the tarmac.
Data journalism · STATS19 2021 to 2025

When riders crash

We know where riders get hurt. This is when. Five years of police-recorded casualties, broken down by month, day, hour and road type.

Bikers' Mind logo

If these numbers hit close to home

Behind every figure on this page is a rider and a family. Bikers' Mind is a mental health support programme for the UK's riders, motorcyclists and cyclists alike, delivered in partnership with Mental Health 360 CIC, a community interest company providing mental health support across the UK.

It includes plain English guides on life after a road accident, written with Mental Health 360.

Read about Bikers' Mind

If you or someone else is in immediate danger, call 999. If you need to talk to someone now, call Samaritans free on 116 123, day or night, or text SHOUT to 85258.

Last updated:

81,166

Motorcyclist casualties

1,701

Riders killed

June

Worst month, 3,218 KSI

Thu 5pm

Worst hour of the week, 442 KSI

When do most motorcycle crashes happen in the UK?

In June, on a Friday, at about five in the afternoon. Between 2021 and 2025 the police recorded 81,166 motorcyclist casualties in Great Britain, of whom 1,701 were killed and 26,011 were seriously injured. June is the worst month, with 3,218 riders killed or seriously injured against 1,315 in January. Friday is the worst day, with 4,412. The single worst hour of the week is Thursday between 5pm and 6pm, which accounts for 442 riders killed or seriously injured across the five years.

Over the same period there were 77,741 pedal cyclist casualties, of whom 450 were killed. Cyclists follow a different pattern, and the difference is the point of this page.

Which month is worst?

Motorcyclist and cyclist casualties killed or seriously injured by month, Great Britain, 2021 to 2025 combined.
MonthMotorcyclist KSICyclist KSI
January13151230
February14041153
March19781399
April25141517
May28531932
June32182080
July28822048
August31571958
September27651898
October23081640
November18951517
December14231131

May to September carries 54% of the year's motorcyclist KSI casualties in five months of the twelve. August is the deadliest month by fatalities, with 249 riders killed. The gap between the worst month and the quietest is 2.45 times for motorcyclists and 1.84 times for cyclists, which is what you would expect from a vehicle most people put away for the winter.

Which day and hour are worst?

Motorcyclist and cyclist KSI casualties by day of week, Great Britain, 2021 to 2025 combined.
DayMotorcyclist KSICyclist KSI
Sunday42362225
Monday35522607
Tuesday36272935
Wednesday37473021
Thursday37963129
Friday44123024
Saturday43422562

Motorcyclists and cyclists get hurt on opposite days. The three worst days for motorcyclists are Friday, Saturday and Sunday. The worst day for cyclists is Thursday, and their safest day by a distance is Sunday. One pattern is leisure riding, the other is commuting.

KSI casualties by hour of day, weekday against weekend, Great Britain, 2021 to 2025 combined.
HourMotorcyclists weekdayMotorcyclists weekendCyclists weekdayCyclists weekend
0017117610375
01106975443
02101673141
0367593621
0472315625
052164719332
064775947546
07953111973102
089661701285211
09622289689305
10610434619419
11790653629405
121045760738468
131084795734353
141213837820339
1514197671024298
1618747331247315
1720066051430306
1814865141195264
191217412871229
20951335543158
21775245420143
22565233323106
2334814922883

On weekdays both peak between 5pm and 6pm. At weekends the shape changes completely: motorcyclists peak at 2pm and cyclists at midday, and the morning commuter spike disappears.

Sun
Mon
Tue
Wed
Thu
Fri
Sat
Motorcyclist KSI casualties by day and hour, Great Britain, 2021 to 2025 combined. Darker means more.

The heatmap shows two separate risks on the same map. The bright block at the bottom left is the weekend afternoon ride-out. The vertical stripe at 5pm running Monday to Friday is the commute.

Do most crashes happen in bad weather?

No, and it is not close. 82% of motorcyclist casualties happened in fine weather with no high winds, 76% happened on a dry road and 74% happened in daylight. Rain accounts for 9%.

That is not the same as saying rain is safe. More people ride in fine weather on dry roads, so more of everything happens there, crashes included. What the data can tell you is how badly people are hurt once a crash has happened, and that answer is very different.

Motorcyclist casualties by conditions at the collision, Great Britain, 2021 to 2025.
ConditionCasualtiesShare of casualtiesKilledDeaths per 100 casualties
Light
Daylight60,15074.1%1,2702.11
Darkness - lights lit16,87020.8%2451.45
Darkness - no lighting2,3282.9%1395.97
Darkness - lighting unknown1,2771.6%302.35
Darkness - lights unlit5340.7%173.18
Weather
Fine no high winds66,66082.1%1,5332.30
Raining no high winds7,2068.9%921.28
Other2,2362.8%210.94
Fine + high winds6270.8%213.35
Raining + high winds5500.7%122.18
Fog or mist2560.3%155.86
Road surface
Dry61,44975.7%1,4392.34
Wet or damp15,82819.5%2511.59
Frost or ice7180.9%70.97

Motorcyclist casualties by conditions at the collision, Great Britain, 2021 to 2025.

Where do riders actually die?

Casualties and deaths do not happen in the same places, and the gap between them is the most useful thing in this dataset.

Of every 100 motorcyclist casualties on a 20mph road, 0.34 died. On a 30mph road, 1.12. On a 60mph road, 6.33. The 60mph rural single carriageway is the deadliest road type in Britain for riders, and it is deadlier than the motorway, where the figure is 4.98 per 100.

Motorcyclist and cyclist casualties by speed limit of the road, with deaths per 100 casualties, Great Britain, 2021 to 2025.
Speed limitMotorcyclistsCyclists
CasualtiesKilledDeaths per 100CasualtiesKilledDeaths per 100
20 mph17,959610.3423,070420.18
30 mph38,8474361.1245,5821830.40
40 mph7,3682182.964,175531.27
50 mph3,8311844.801,122343.03
60 mph10,8516876.333,5401213.42
70 mph2,3101154.98252176.75

Motorcyclist and cyclist casualties by speed limit of the road, with deaths per 100 casualties, Great Britain, 2021 to 2025.

Rural roads hold 31% of motorcyclist casualties and 72% of motorcyclist deaths. The Department for Transport's own motorcyclist factsheet puts 70% of motorcycle fatalities on rural roads over the same five years, worked out separately from national traffic data, which is a useful check on the figure above.

Junctions are where riders get hurt. Open road is where they die. 41,896 motorcyclist casualties happened at or near a junction against 33,337 away from one, but the away-from-junction group holds 1,059 deaths against 617, more than twice the death rate per casualty.

Unlit darkness is 3% of motorcyclist casualties and 8% of motorcyclist deaths: 5.97 deaths per 100 casualties against 2.11 in daylight.

Wet roads are the exception that makes the point. There are 1.59 deaths per 100 casualties on a wet or damp road against 2.34 on a dry one, because wet-road crashes happen disproportionately in slow urban traffic.

Is it getting better or worse?

For riders it is getting worse. For cyclists it is getting better.

Motorcyclists and cyclists killed per year, Great Britain, 2021 to 2025.
YearMotorcyclists killedCyclists killed
2021310111
202235091
202331587
202434082
202538679

Motorcyclist deaths ran 310, 350, 315, 340 and 386 across the five years, a rise of 25%. Cyclist deaths ran 111, 91, 87, 82 and 79, a fall of 29%. Two groups of vulnerable road users on the same roads, moving in opposite directions.

How to read these numbers

These are counts of people, not rates of risk. June has more casualties than January partly because far more people ride in June. Nothing on this page says a sunny afternoon is more dangerous per mile than a wet night, and DfT does not publish exposure by month, day or hour, so no such rate can be worked out from this data.

Deaths per 100 casualties is a different measure and it does not have that problem. It only compares people who were already in a reported collision, so it answers a narrower and more answerable question: once something has gone wrong, how likely is it to be fatal.

Police data undercounts injured riders, and undercounts injured cyclists more, because a cyclist has no obligation to report a collision. Treat every count here as a floor.

Severity is as reported by the police and is not severity-adjusted. DfT publishes an adjusted figure to account for changes in police reporting systems since 2016, which is why its 2025 total of 5,710 seriously injured motorcyclists differs from the 5,616 counted here. Both reconcile to the same 386 deaths. We use the unadjusted count so that this page and our most dangerous roads page count the same thing.

Weather, light and road surface are recorded once for the collision, not for each casualty.

Method

Figures are computed from the Department for Transport's STATS19 road casualty open data, the record of every road casualty reported to the police in Great Britain, using the collision and casualty files for 2021 to 2025 with the 2025 final release published on 30 July 2026. Motorcyclists are casualty_type 2, 3, 4, 5, 23 and 97, which covers riders and passengers of any engine size. Pedal cyclists are casualty_type 1. Every coded field is decoded through DfT's published data guide rather than an assumed lookup, and the build reports any code it cannot map. It currently maps all of them.

As a check, the same pipeline reproduces the 2025 totals already published on our most dangerous roads page exactly: 386 motorcyclists killed, 5,616 seriously injured and 9,445 slightly injured, and 79 cyclists killed, 4,224 seriously injured and 11,739 slightly injured.

Data and citation

The figures on this page are derived from public sector information licensed under the Open Government Licence v3.0. You are free to reuse them with attribution.

Cite as: Bikers.co.uk (2026), When riders crash: motorcyclist and cyclist casualties by month, day and hour, Great Britain 2021 to 2025. Derived from DfT STATS19 open data.

Download the data (JSON)

Our companion dataset on GitHub

Dataset DOI: 10.5281/zenodo.22165465

DfT source collection, gov.uk

Share a fact

Fact 1 of 8

June is the worst month to be a rider. 3,218 motorcyclists were killed or seriously injured in June across 2021 to 2025, against 1,315 in January.

Source: DfT STATS19, 2021 to 2025. See the data

Before you share this. These are counts of people from the police record of reported road casualties, not risk rates, and not an allegation against anyone. The source is included in the share text so it travels with the number. What you write alongside it is yours, not ours.

Read next

Frequently asked questions

What is the most dangerous month to ride a motorcycle in the UK?

June. Between 2021 and 2025 there were 3,218 motorcyclists killed or seriously injured in June, against 1,315 in January. August is the deadliest month by fatalities, with 249 riders killed over the five years.

What time of day do most motorcycle accidents happen?

Between 5pm and 6pm on weekdays, and around 2pm at weekends. The single worst hour of the week is Thursday between 5pm and 6pm, with 442 riders killed or seriously injured from 2021 to 2025.

Do most motorcycle accidents happen in bad weather?

No. 82% of motorcyclist casualties happened in fine weather with no high winds and 76% happened on a dry road. This mostly reflects when people ride rather than how safe those conditions are.

Which roads are deadliest for motorcyclists?

Rural roads with a 60mph limit. Of every 100 motorcyclist casualties on a 60mph road, 6.33 died, against 1.12 on a 30mph road and 4.98 on a motorway.

Are motorcycle deaths in Britain going up or down?

Up. Motorcyclist deaths rose from 310 in 2021 to 386 in 2025, a rise of 25%. Cyclist deaths fell over the same period, from 111 to 79.

How many motorcyclists are killed on British roads each year?

386 motorcyclists were killed in Great Britain in 2025. Across 2021 to 2025 the total was 1,701, an average of 340 a year.