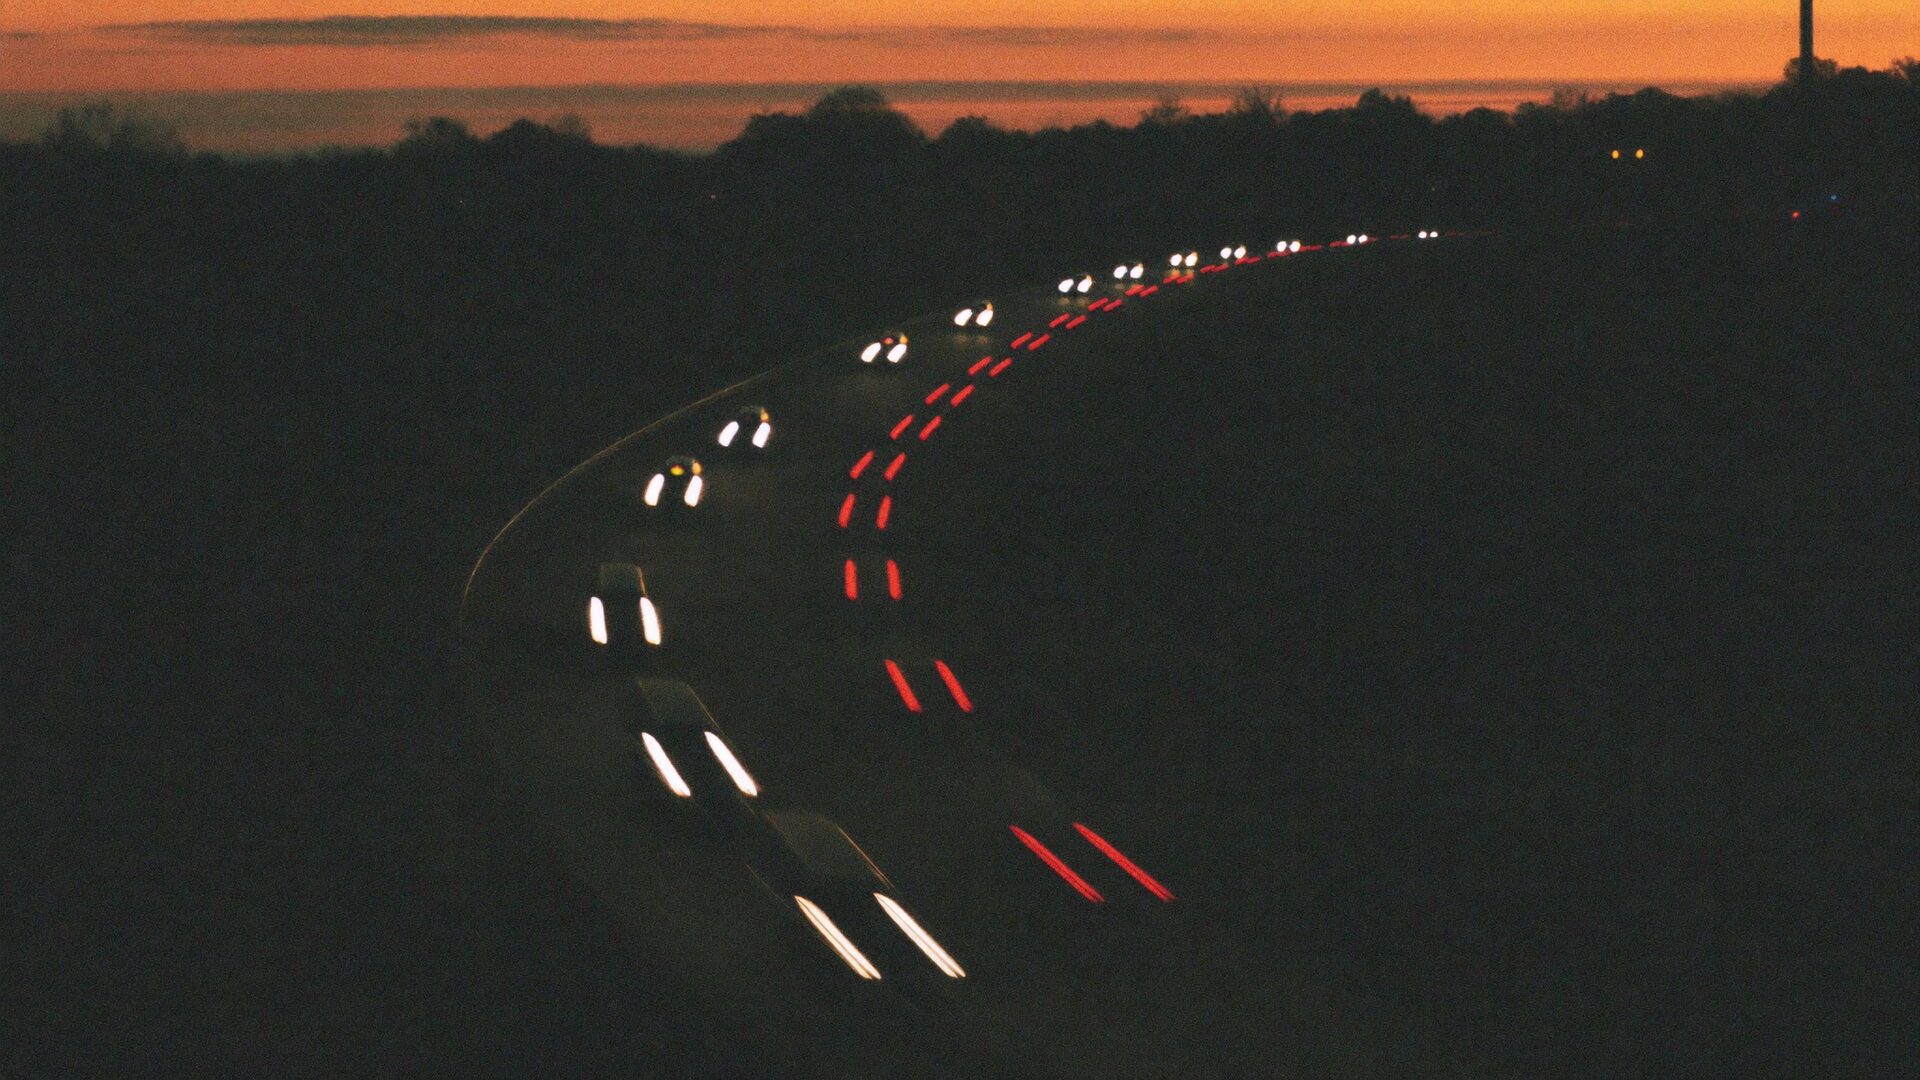
Vehicle light trails curving along a British dual carriageway at dusk, seen from above.
Original analysis

Research and road data

We publish our own analysis of who gets hurt on Britain's roads, built from the police record of every reported casualty. Method, source and limits on every page.

Bikers.co.uk publishes its own analysis of UK road casualty data. Every figure comes from the Department for Transport's STATS19 records, the police report of every road casualty in Great Britain. Every page shows its method, its source and its limits. Nothing here is modelled, estimated or bought in.

We publish the underlying data as well, under the Open Government Licence, so anyone can check the working or reuse it.

Casualty rates

The roads that are actually most dangerous

Every danger ranking counts casualties, which rewards long busy roads. We divided five years of casualties by how far people actually ride on each road, and only four of the top twenty survive.

Last updated:

Casualty timing

When riders crash

The month, day and hour of every motorcyclist and cyclist casualty in Great Britain from 2021 to 2025. June, Friday and five in the afternoon, and why a 60mph rural road kills more riders per casualty than a motorway does.

Last updated:

Regional breakdown

Dangerous roads by police force area

The same 2025 figures split across all 44 police force areas in Britain, with the worst road for motorcyclists and cyclists in each one.

Last updated:

Cyclists

Dangerous roads for cyclists

The cyclist analysis on its own, road by road, for anyone who rides two wheels without an engine.

Last updated:

How we work

Source. Every page is built from the Department for Transport's STATS19 open data, the record of every road casualty reported to the police in Great Britain, published under the Open Government Licence v3.0.

Unit. We count casualties, meaning people, rather than collisions, so a single crash that injures two riders counts twice.

Severity. We use severity as reported by the police, without DfT's statistical adjustment, and we use it consistently across every page so the numbers on one page can be compared with another.

Checking. Each build reconciles its own output against figures we have already published. If a total moves, the build fails rather than quietly publishing a different number.

Limits. Police data undercounts injured riders and undercounts injured cyclists more, because a cyclist has no obligation to report a collision. Treat every count as a floor.

For journalists and researchers

Every chart on these pages can be reproduced from the data we publish. You are free to use the figures with attribution to Bikers.co.uk and to the Department for Transport.

If you quote a figure, a link back to the page you took it from is appreciated, and it lets your readers check the working.